Leaderboards
Use W&B Weave Leaderboards to evaluate and compare multiple models across multiple metrics and measure accuracy, generation quality, latency, or custom evaluation logic. A leaderboard helps you visualize model performance in a central location, track changes over time, and align on team-wide benchmarks.
Leaderboards are ideal for:
- Tracking model performance regressions
- Coordinating shared evaluation workflows
Create a Leaderboard
You can create a leaderboard via the Weave UI or programmatically.
UI
To create and customize leaderboards directly in the Weave UI:
- In the Weave UI, Navigate to the Leaders section. If it's not visible, click More → Leaders.
- Click + New Leaderboard.
- In the Leaderboard Title field, enter a descriptive name (e.g.,
summarization-benchmark-v1). - Optionally, add a description to explain what this leaderboard compares.
- Add columns to define which evaluations and metrics to display.
- Once you're happy with the layout, save and publish your leaderboard to share it with others.
Add columns
Each column in a leaderboard represents a metric from a specific evaluation. To configure a column, you specify:
- Evaluation: Select an evaluation run from the dropdown (must be previously created).
- Scorer: Choose a scoring function (e.g.,
jaccard_similarity,simple_accuracy) used in that evaluation. - Metric: Choose a summary metric to display (e.g.,
mean,true_fraction, etc.).
To add more columns, click Add Column.
To edit a column, click its three-dot menu (⋯) on the right. You can:
- Move before / after – Reorder columns
- Duplicate – Copy the column definition
- Delete – Remove the column
- Sort ascending – Set the default sort for the leaderboard (click again to toggle descending)
Python
Looking for a complete, runnable code sample? See the End-to-end Python example.
To create and publish a leaderboard:
-
Define a test dataset. You can use the built-in
Dataset, or define a list of inputs and targets manually:dataset = [
{"input": "...", "target": "..."},
...
] -
Define one or more scorers:
@weave.op
def jaccard_similarity(target: str, output: str) -> float:
... -
Create an
Evaluation:evaluation = weave.Evaluation(
name="My Eval",
dataset=dataset,
scorers=[jaccard_similarity],
) -
Define models to be evaluated:
@weave.op
def my_model(input: str) -> str:
... -
Run the evaluation:
 async def run_all():
     await evaluation.evaluate(model_vanilla)
     await evaluation.evaluate(model_humanlike)
     await evaluation.evaluate(model_messy)

asyncio.run(run_all()) -
Create the leaderboard:
spec = leaderboard.Leaderboard(
    name="My Leaderboard",
    description="Evaluating models on X task",
    columns=[
        leaderboard.LeaderboardColumn(
            evaluation_object_ref=get_ref(evaluation).uri(),
            scorer_name="jaccard_similarity",
            summary_metric_path="mean",
        )
    ]
) -
Publish the leaderboard.
weave.publish(spec) -
Retrieve the results:
results = leaderboard.get_leaderboard_results(spec, client)
print(results)
End-to-End Python example
The following example uses Weave Evaluations and creates a leaderboard to compare three summarization models on a shared dataset using a custom metric. It creates a small benchmark, evaluates each model, scores each model with Jaccard similarity, and publishes the results to a Weave leaderboard.
import weave
from weave.flow import leaderboard
from weave.trace.ref_util import get_ref
import asyncio

client = weave.init("leaderboard-demo")

dataset = [
    {
        "input": "Weave is a tool for building interactive LLM apps. It offers observability, trace inspection, and versioning.",
        "target": "Weave helps developers build and observe LLM applications."
    },
    {
        "input": "The OpenAI GPT-4o model can process text, audio, and vision inputs, making it a multimodal powerhouse.",
        "target": "GPT-4o is a multimodal model for text, audio, and images."
    },
    {
        "input": "The W&B team recently added native support for agents and evaluations in Weave.",
        "target": "W&B added agents and evals to Weave."
    }
]

@weave.op
def jaccard_similarity(target: str, output: str) -> float:
    target_tokens = set(target.lower().split())
    output_tokens = set(output.lower().split())
    intersection = len(target_tokens & output_tokens)
    union = len(target_tokens | output_tokens)
    return intersection / union if union else 0.0

evaluation = weave.Evaluation(
    name="Summarization Quality",
    dataset=dataset,
    scorers=[jaccard_similarity],
)

@weave.op
def model_vanilla(input: str) -> str:
    return input[:50]

@weave.op
def model_humanlike(input: str) -> str:
    if "Weave" in input:
        return "Weave helps developers build and observe LLM applications."
    elif "GPT-4o" in input:
        return "GPT-4o supports text, audio, and vision input."
    else:
        return "W&B added agent support to Weave."

@weave.op
def model_messy(input: str) -> str:
    return "Summarizer summarize models model input text LLMs."

async def run_all():
    await evaluation.evaluate(model_vanilla)
    await evaluation.evaluate(model_humanlike)
    await evaluation.evaluate(model_messy)

asyncio.run(run_all())

spec = leaderboard.Leaderboard(
    name="Summarization Model Comparison",
    description="Evaluate summarizer models using Jaccard similarity on 3 short samples.",
    columns=[
        leaderboard.LeaderboardColumn(
            evaluation_object_ref=get_ref(evaluation).uri(),
            scorer_name="jaccard_similarity",
            summary_metric_path="mean",
        )
    ]
)

weave.publish(spec)

results = leaderboard.get_leaderboard_results(spec, client)
print(results)
View and interpret the Leaderboard
After the script finishes running, view view the leaderboard:
- In the Weave UI, go to the Leaders tab. If it's not visible, click More, then select Leaders.
- Click on the name of your leaderboard—e.g.
Summarization Model Comparison.
In the leaderboard table, each row represents a given model (model_humanlike, model_vanilla, model_messy). The mean column shows the average Jaccard similarity between the model's output and the reference summaries.
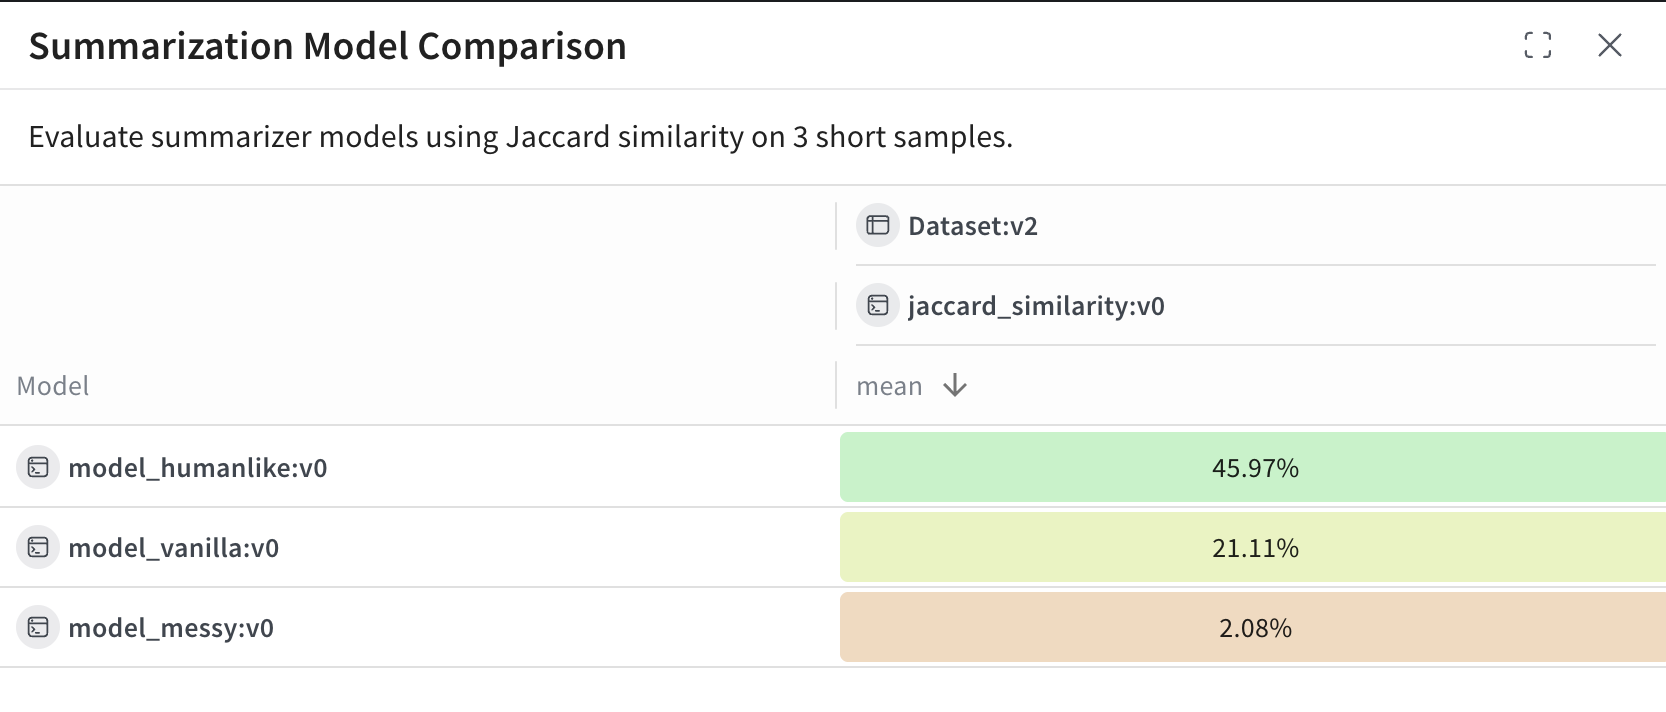
For this example:
model_humanlikeperforms the best, with ~46% overlap.model_vanilla(a naive truncation) gets ~21%.model_messyan intentionally bad model, scores ~2%.