Navigate the Trace View
The W&B Weave Trace view is designed to help you make sense of complex execution paths in your LLM and agentic apps. Whether you're debugging an agentic app with dozens of nested calls, or tracking the flow of a single model prediction, the Trace view provides a clear breakdown, while also providing alternate ways to view and understand your application flow.
This guide describes how to move through the trace stack, filter and search for ops, switch between visual representations, and more.
Get started
To enter the Trace view:
- Navigate to the Traces tab.
- Click on any trace to open the Trace view. The Trace view pops out and displays a hierarchical breakdown of the trace execution.
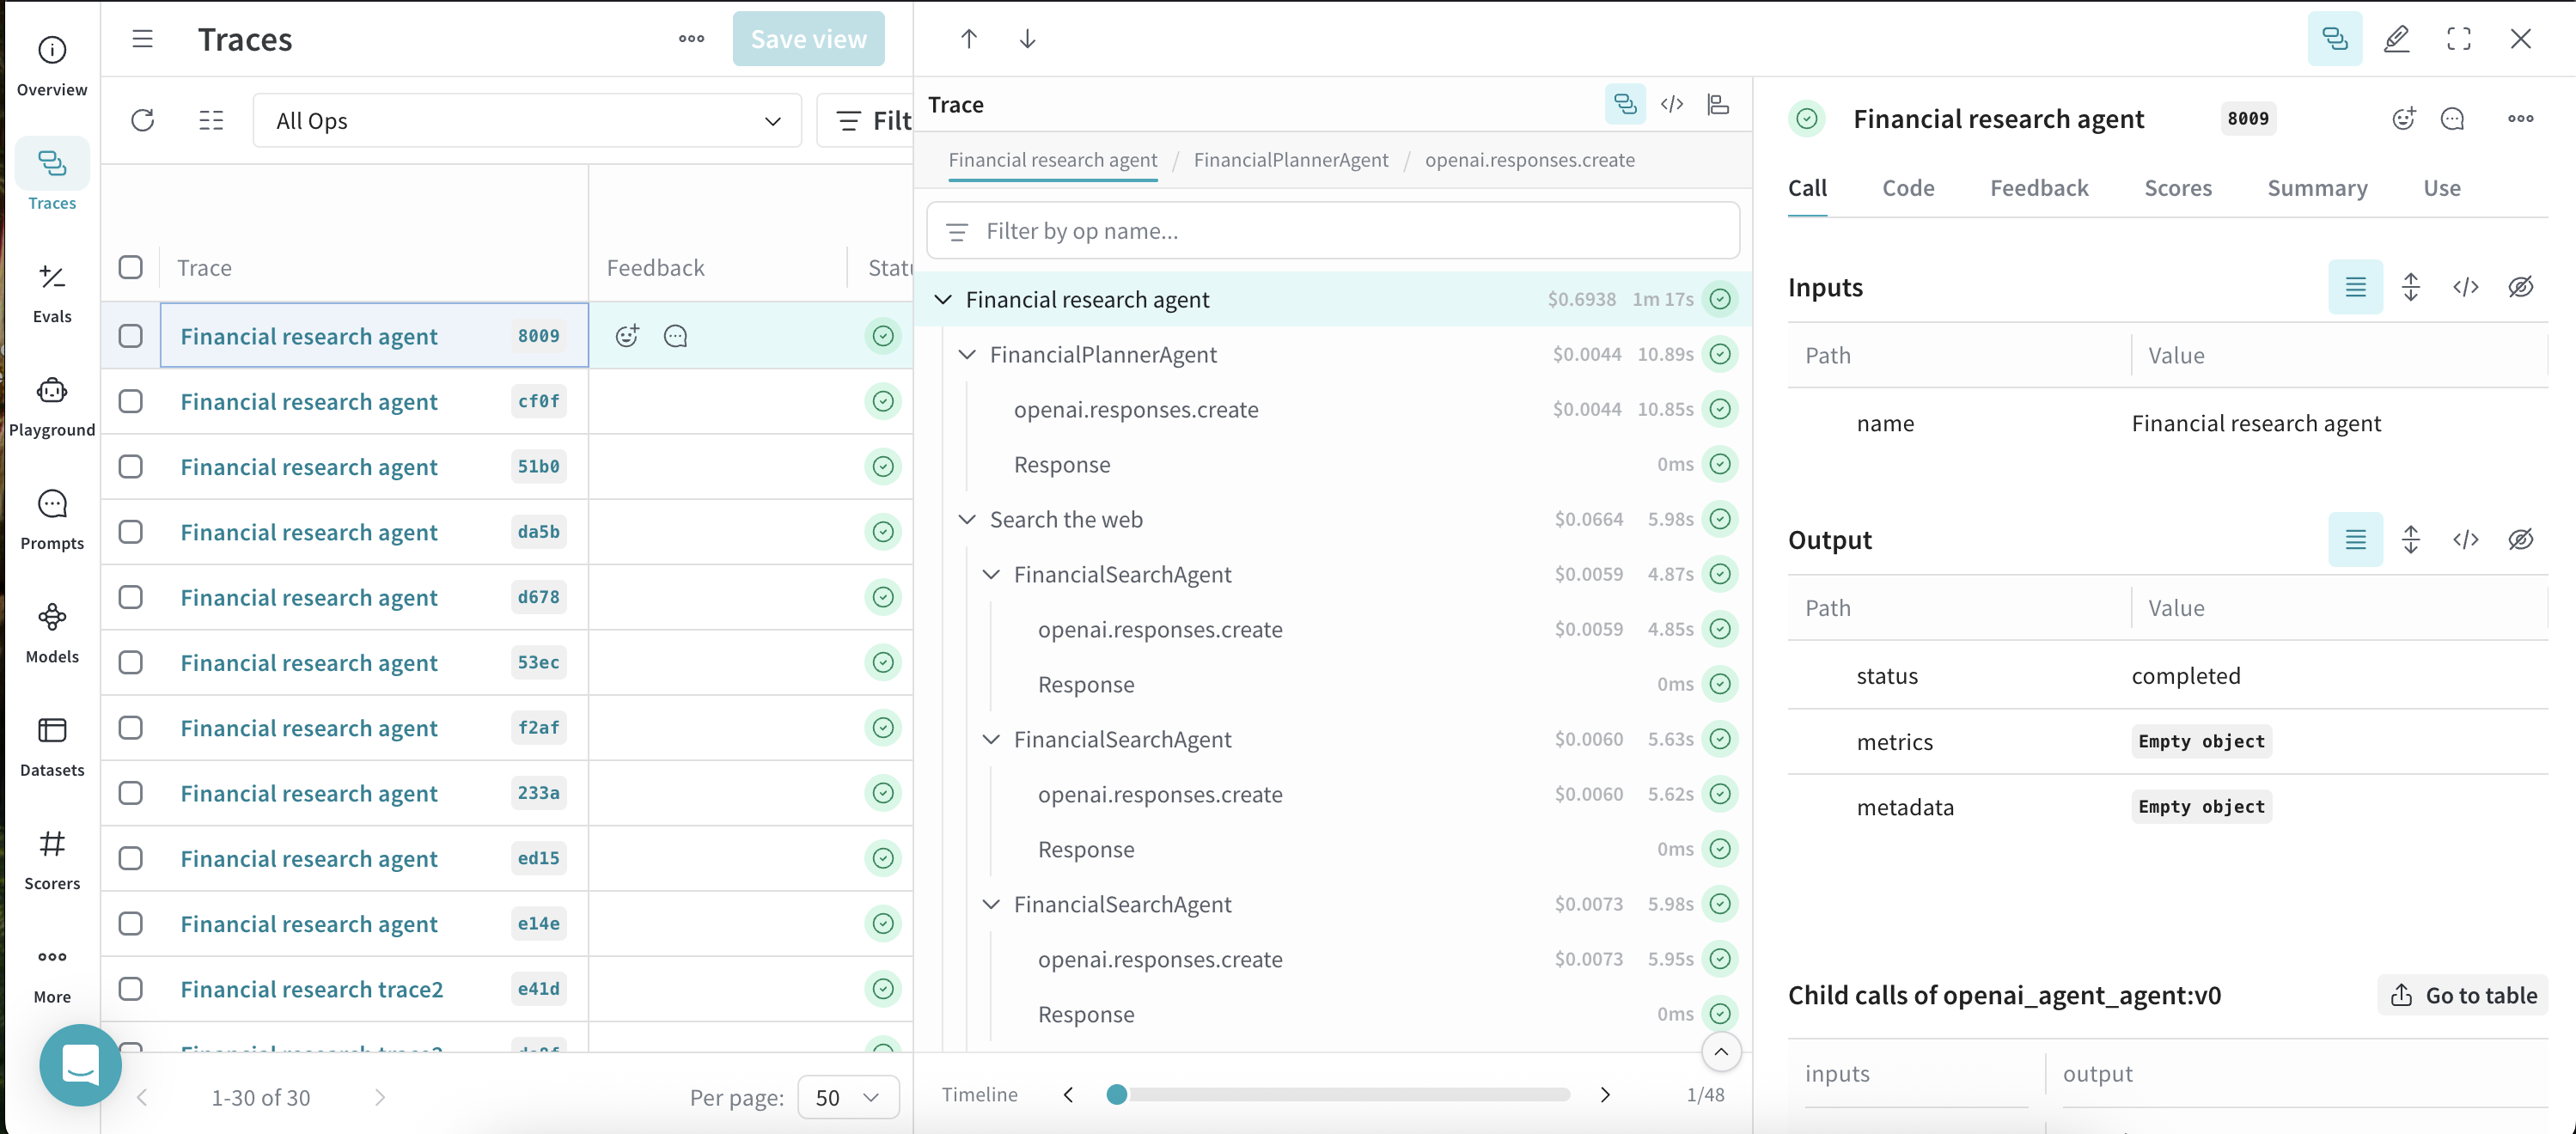
Traces page overview
The Traces page is composed of three core panels:
- Left sidebar: A sortable, paginated list of all trace runs for the project.
- Center panel: Interactive trace view showing the stack and ops hierarchy for a selected trace.
- Right panel: Detailed view for a selected op (Call, Code, Feedback, Scores, Summary, Use).
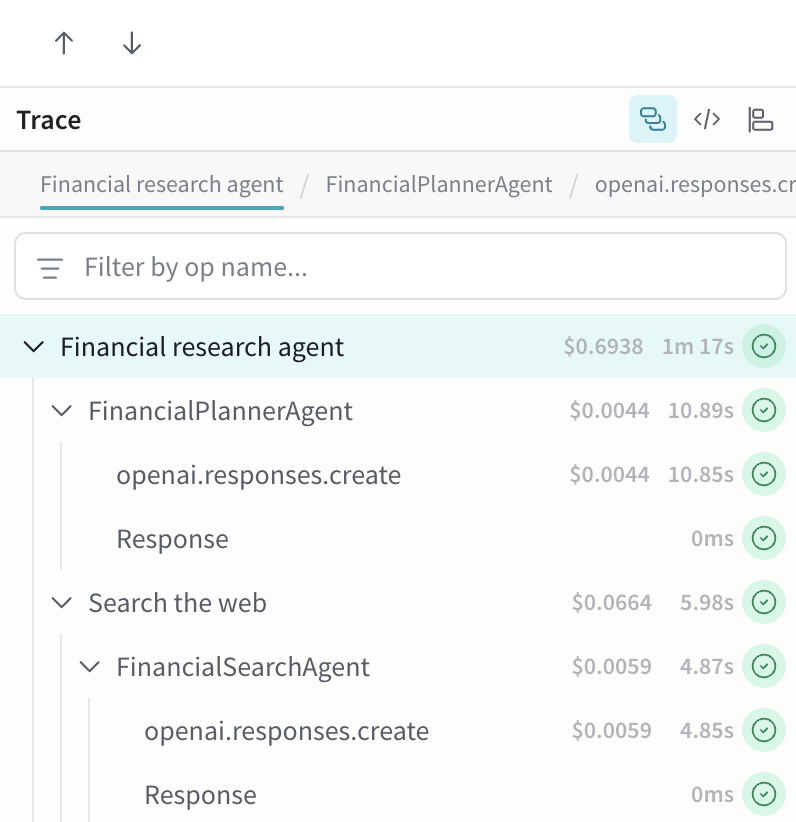
Trace view navigation
- Breadcrumbs: At the top of the center panel, navigate up and down the trace stack via the breadcrumb trail.
- Stack arrows: Use the
↑and↓buttons to move up and down the stack. - Double-click: Double-click on an op to focus the view exclusively on that substack.
- "Jump to Top" Button: Return to the root of the trace stack.
Filter and search
- Filter an op by name: Use the input bar above the trace tree to search for ops of a specific type (e.g.,
tool,openai.response.create). - Filter persistence: Selecting ops across traces retains the sub-path context for easier comparison.
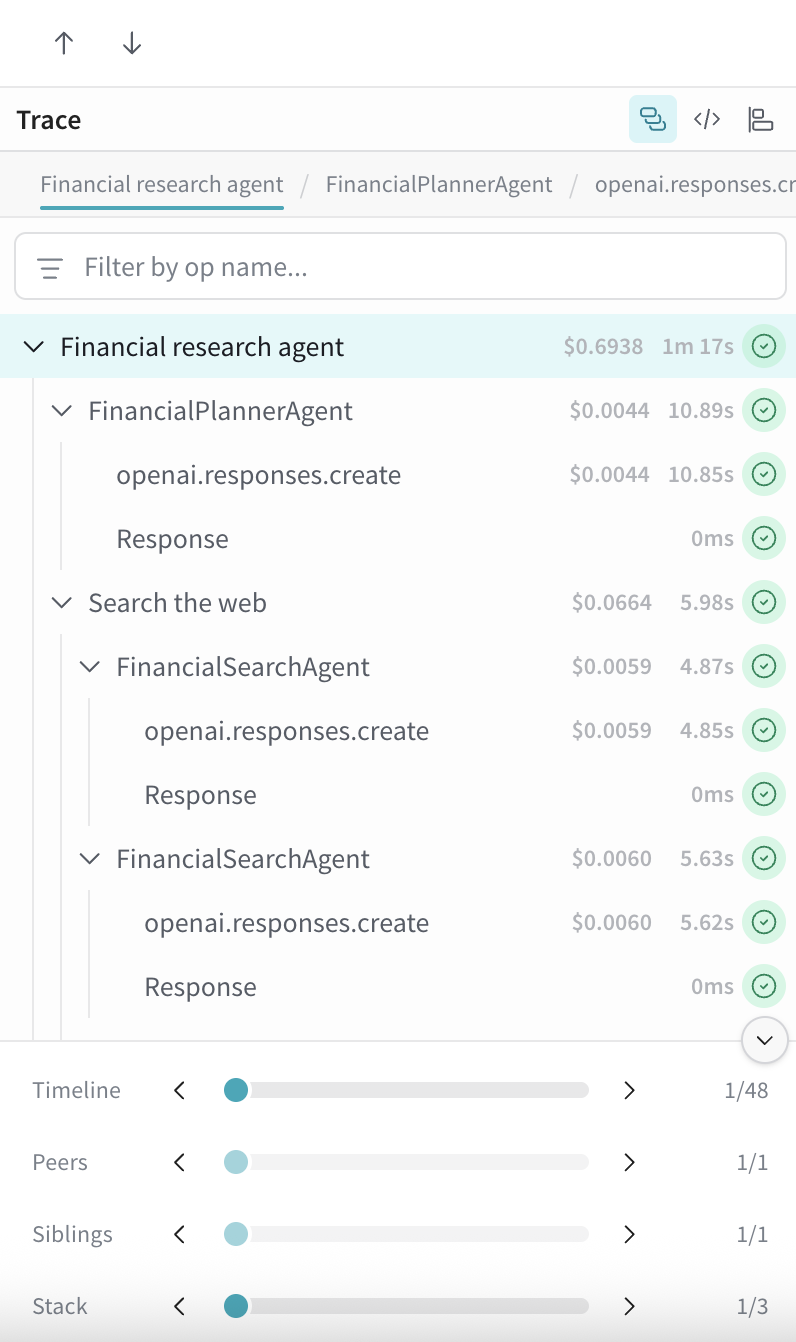
Scrubbers and contextual navigation
The panel below the tree includes multiple scrubbers for navigating across calls:
- Timeline: Chronological order of events.
- Peers: Ops sharing the same type.
- Siblings: Ops with the same parent.
- Stack: Traverse up/down the call stack.
To view the available scrubbers, click the ^ button at the bottom of the panel.
Each scrubber has a slider and > jump buttons to move step-by-step.
Alternate trace tree views
You can switch between multiple visual representations of the trace tree depending on your needs. To switch to an alternate trace view, click one of available options (default trace view, code composition, flame graph, graph view) in the upper right corner
Traces (default)
The default view showing, stack hierarchy, cost per op, execution time, and status indicators.
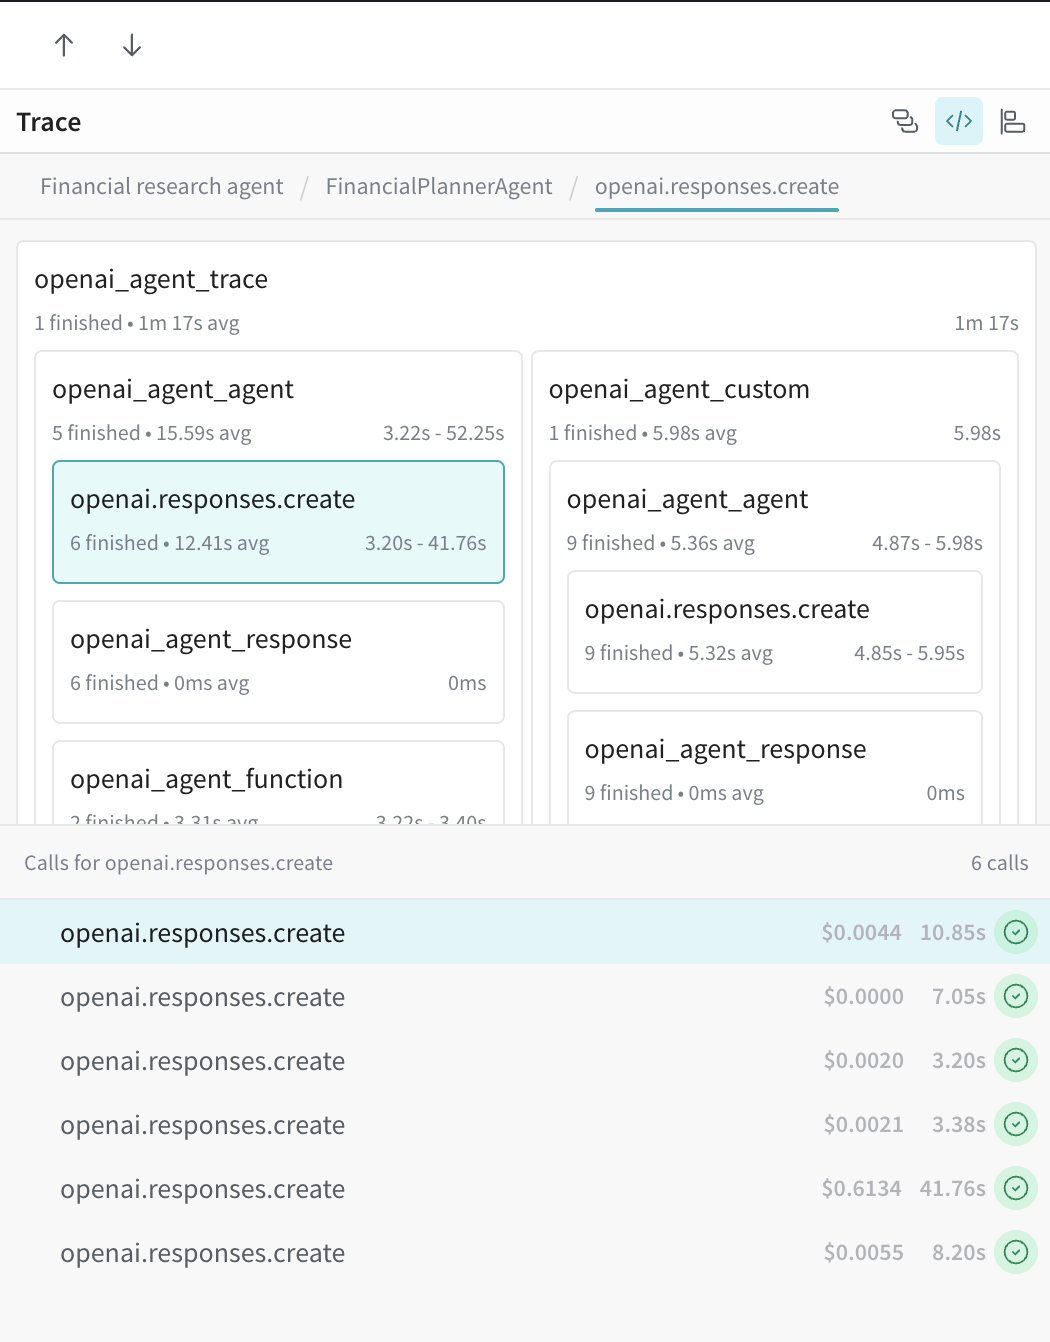
Code view
In the code view, boxes represent ops and their nested calls. This is helpful for visualizing flow of function calls. In this view, you can click on a box to drill into that op and filter the call path.
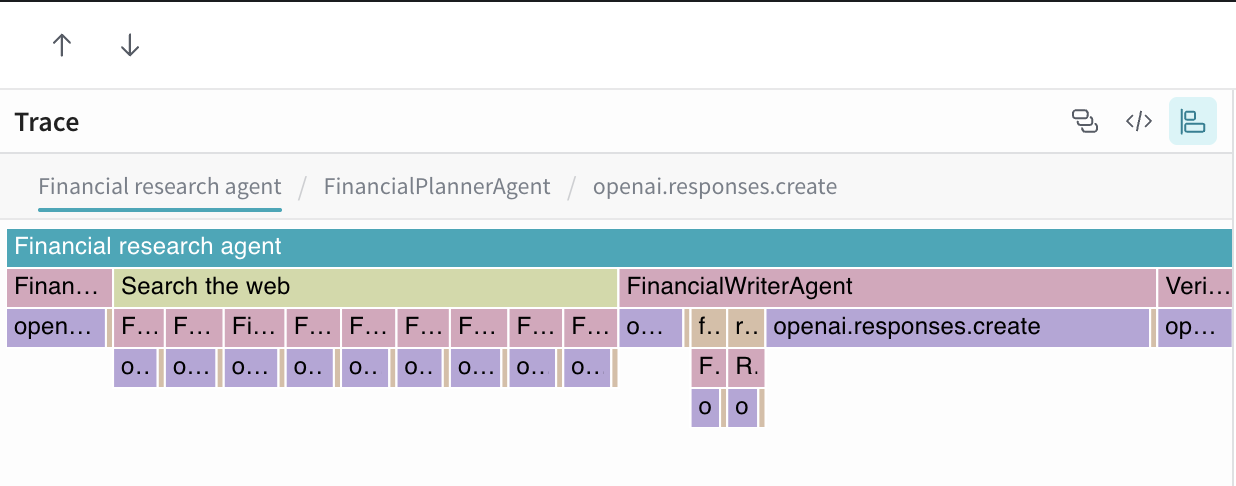
Flame graph
The flame graph view provides a timeline-based visualization of execution depth and duration. This is helpful for when trying to understand performance diagnostics over time. You can click into frames to isolate sub-traces.
Graph view
The graph view shows hierarchical relationships between ops. This is useful for understanding parent/child relationships.
Usage tips and tricks
- Use the "Filter by op name” search bar at the top of the trace tree view to quickly isolate relevant tool or LLM calls.
- Switch between views based on your debugging need. Use Code View for call logic, Flame Graph for to understand performance over time, and Graph View to understand structure.